

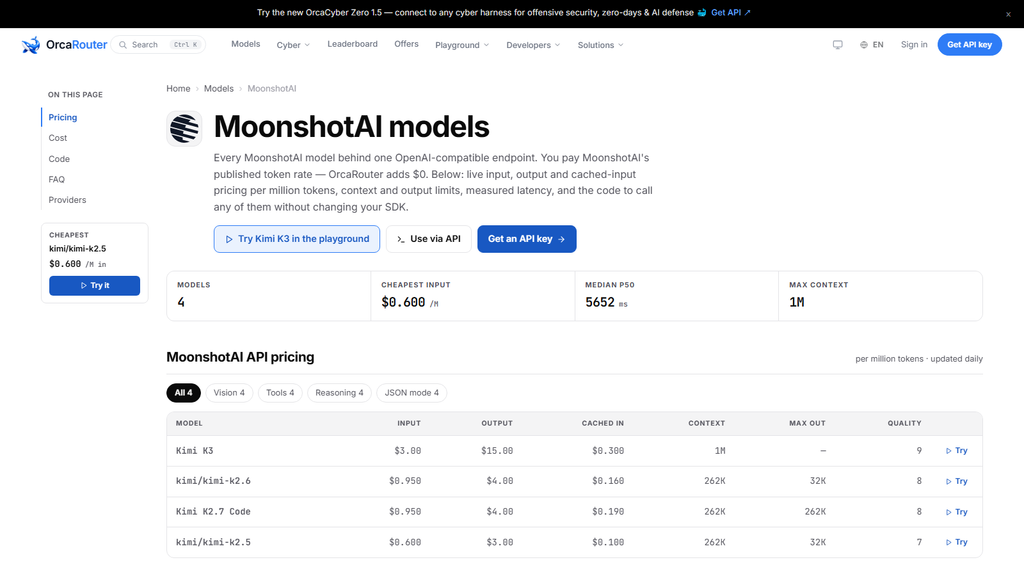
5681 milliseconds is the median p50 on the OrcaRouter Kimi API page, and it is the slowest median of the seven provider catalogues the site publishes: 3.6 times the 1600 ms printed on the OpenAI page, and the only figure in the set that crosses five and a half seconds.
A latency number on a provider page does not describe a model. It describes a pipeline, and it only starts to matter at the moment that pipeline stops calling one model and starts calling several. A fan-out step waits for all of its legs. A step that waits for all of its legs is timed by the slowest one. That is the whole argument of this piece, and 5681 ms is where it starts.
Seven medians, read as clusters
Read the seven provider pages in one sitting and the latency column does not sort into a ranking; it sorts into clusters. Two catalogues sit under two seconds — OpenAI at 1600 ms and DeepSeek at 1816 ms [OURS]. Three sit in a narrow band just above four seconds: Qwen at 4000 ms, Anthropic at 4034 ms and Z.ai at 4052 ms, a spread of 52 ms across the three. Grok stands alone at 5000 ms, and Kimi sits alone at the top.
| Provider page | Models on the page | Median p50 (ms) |
| OpenAI | 76 | 1600 |
| DeepSeek | 9 | 1816 |
| Qwen | 27 | 4000 |
| Anthropic | 13 | 4034 |
| Z.ai | 10 | 4052 |
| Grok | 5 | 5000 |
| Kimi | 4 | 5681 |
The number worth carrying away is the distance between the two ends. 5681 minus 1600 is 4081 ms of extra waiting on a median, before the first token of a response arrives. That is not a bad afternoon on one server and it is not a rounding artefact: a median is the middle of the distribution, so half of the Kimi requests that ran through the gateway took longer than that figure and half took less.
All seven values are medians over our own production traffic, measured on live requests through the gateway rather than copied from vendor documentation [OURS]. A median is the right summary here because it survives a tail. A mean would let one slow morning move the number, and a maximum would describe a request nobody builds a product around.
Why there is no tokens-per-second column
There is one column these pages do not carry, and the absence is a decision rather than an oversight: no tokens-per-second figure appears anywhere on a provider page. The reason is comparability, not secrecy. A generation rate is a property of a stream, not of a model. It moves with the prompt you sent, the size of the payload, the client reading it, the connection underneath, and the load on the upstream service in that particular minute. Two catalogues measured under different conditions produce two rates that cannot be subtracted from one another, and printing a rate next to a median latency puts two different kinds of measurement into the same table, inviting a reader to compare them as though they described the same thing.
So the pages publish the figure that survives into a budget — p50 time to first token, in milliseconds — and leave the rate off. What a user actually perceives is the gap between sending a request and seeing something appear; after that, the experience is a stream they are already reading, and a stream has no single speed you could write in a cell. The gap is the part that fits a service-level target, and it is the only part these pages quantify.
The fan-out arithmetic
Fan-out is where a slow median stops being trivia. If a step calls five models in parallel and merges all five, the step finishes when the slowest leg finishes. The four fast legs bought you concurrency, which you had the moment you fired them; they did not buy you time. On the numbers above, a fan-out that touches both Kimi and DeepSeek has a floor of 5681 ms, and the DeepSeek leg at 1816 ms will have been sitting in memory for 3865 ms of it.
A chained pipeline pays in a different way. Three sequential calls whose individual medians are each 5681 ms are not a 5681 ms step. The arithmetic of medians through a chain is not a measurement, but it is a warning worth having: three hops of five and a half seconds land near seventeen seconds before a person reads a word.
Neither of those is an argument against a slow catalogue. It is an argument for reading provider pages as capacity planning rather than as a shopping list. A model that scores well but lives in the slowest catalogue is not disqualified by the number — it is expensive in a currency your users pay directly, and it needs a reason to be in the fan-out rather than behind a queue.
What the 5681 ms buys
Kimi’s catalogue is the smallest of the seven at four models, which makes it cheap to read in full.
| Model | Input /M | Output /M | Context | Max output | Quality |
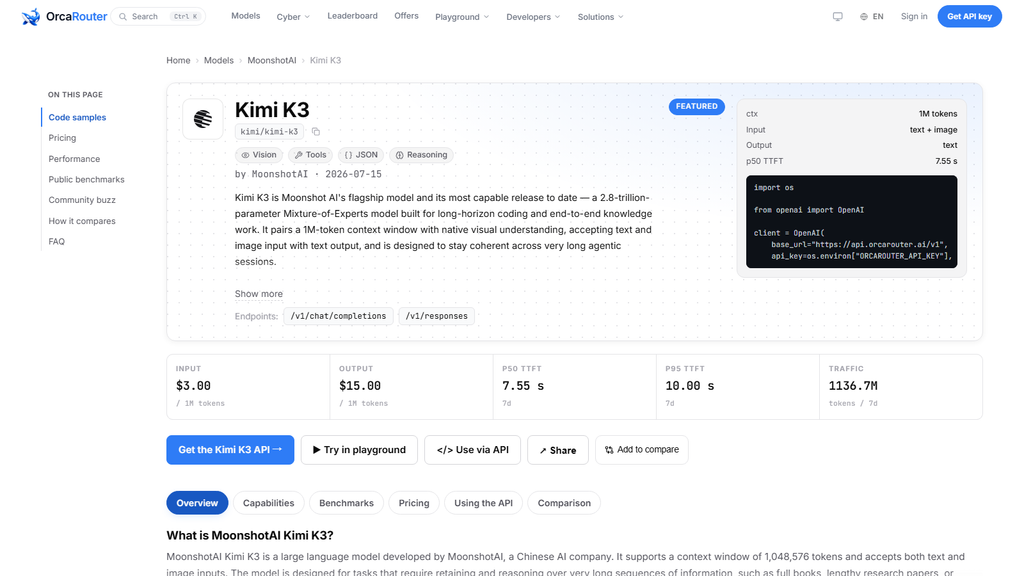
| Kimi K3 | $3.00 | $15.00 | 1M | — | 9 |
| kimi/kimi-k2.6 | $0.950 | $4.00 | 262K | 32K | 8 |
| Kimi K2.7 Code | $0.950 | $4.00 | 262K | 262K | 8 |
| kimi/kimi-k2.5 | $0.600 | $3.00 | 262K | 32K | 7 |
The quality column is our own 0-to-10 composite, built from our own quality dimensions across the catalogue — it is our measurement, not a third-party benchmark — and it is a deliberately coarse instrument. It separates K3 from the three 262K rows by one or two points, and it does not pretend to rank two rows that land on the same digit.
The page’s cheapest-input statistic is $0.600 per million tokens, which the cost FAQ attaches to kimi/kimi-k2.5 [VENDOR — the provider’s published rate, passed through with $0 markup]. K3, the only row whose context column reaches 1M, is $3.00 per million input and $15.00 per million output: five times the floor on input and five times on output. All four models read 4 out of 4 on the page’s capability census for vision, tool calling, reasoning and JSON mode, which is the tidiest capability distribution of any of the seven provider pages — and, at four rows, the least surprising.
One convention is worth naming before you quote it. The FAQ states the largest context window as Kimi K3 at 1048K tokens, while the pricing table’s own context column reads 1M. Those are two ways the same page writes the same window, not two measurements; this piece quotes the table.
The takeaway
A median of 5681 ms is not a verdict on a model. It is a price, denominated in the one currency no rate card shows. Read the seven provider pages as a set and the latency column tells you which catalogues you can afford to place in the critical path and which ones belong behind a queue, a cache, or a cheaper fast model doing the first pass.
Kimi is the catalogue where that decision has to be made deliberately, because there is no second row to fall back on. Four models, one of them reaching the 1M context column, a floor of $0.600 per million input tokens, and the slowest median of the seven. Put it in a fan-out and it becomes the leg that sets the timeout. Put it behind a fast screener and the 5681 ms stops being the thing your users are waiting on. The number does not change; what it costs you does.